| Q.1 |
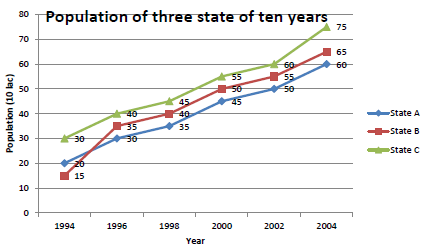
In the graph below, the three states A, B, C at intervals over two years of population (million) is shown. Please answer the questions below.
In the population of state A in which year of the following the ratio of increament was highest comparision to the two years before ,
View Answer Discuss on Question Error In Question |
| Q.2 |
In the graph below, the three states A, B, C at intervals over two years of population (million) is shown. Please answer the questions below.
Over the years, the population of the state C (10 million), was how much?
View Answer Discuss on Question Error In Question |
| Q.3 |
In the graph below, the three states A, B, C at intervals over two years of population (million) is shown. Please answer the questions below.
What is the ratio between the average population in year 1994 of three state and the average population in 1998 of three states ?
View Answer Discuss on Question Error In Question |
| Q.4 |
In the graph below, the three states A, B, C at intervals over two years of population (million) is shown. Please answer the questions below.
Years 1996, 1998 and 2000, the average population of the state B to the state C of the date these three years was the average ratio between the population?
View Answer Discuss on Question Error In Question |
| Q.5 |
In the graph below, the three states A, B, C at intervals over two years of population (million) is shown. Please answer the questions below.
From 2000 until 2004, the percentage increase in total population of the three states was?
View Answer Discuss on Question Error In Question |
| Q.6 |
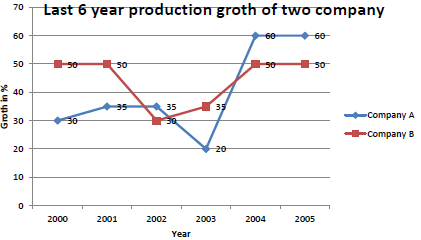
Groups A and B in the graph below two percent increase in production is shown. Read it carefully and answer the questions below.
In 2000 the A company was produced 1.66 million units, then what is the production units in 2002?
View Answer Discuss on Question Error In Question |
| Q.7 |
Groups A and B in the graph below two percent increase in production is shown. Read it carefully and answer the questions below.
Which of the following graph, based on the above statement is certainly true?
View Answer Discuss on Question Error In Question |
| Q.8 |
Groups A and B in the graph below two percent increase in production is shown. Read it carefully and answer the questions below.
Company B in 2004 compared to the previous year, the percentage increase in average production?
View Answer Discuss on Question Error In Question |
| Q.9 |
Groups A and B in the graph below two percent increase in production is shown. Read it carefully and answer the questions below.
If company B, 658125 units produced in 2004, then what is number of units produced in 2002?
View Answer Discuss on Question Error In Question |
| Q.10 |
Groups A and B in the graph below two percent increase in production is shown. Read it carefully and answer the questions below.
In 2004, how much percentage increase in the production of A from last year?
View Answer Discuss on Question Error In Question |
| Q.11 |
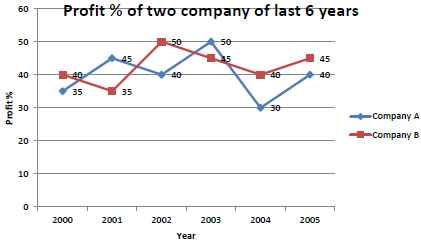
Two companies, A and B in the graph below by percent gain made in the last 6 years have been. Read it carefully and answer the questions below.
the earning ratio of B company in the year 2002 and 2003 is 2: 3, then during these two years the company's expense ratio was?
View Answer Discuss on Question Error In Question |
| Q.12 |
Two companies, A and B in the graph below by percent gain made in the last 6 years have been. Read it carefully and answer the questions below.
In these 6 years the total expenditure A is Rs 165 million, then what was the total income of the company?
View Answer Discuss on Question Error In Question |
| Q.13 |
Two companies, A and B in the graph below by percent gain made in the last 6 years have been. Read it carefully and answer the questions below.
In 2005, the expenditure of A and B are identical and both have a total income of 11.4 million, then what was the total expenditure of two companies in this year,?
View Answer Discuss on Question Error In Question |
| Q.14 |
Two companies, A and B in the graph below by percent gain made in the last 6 years have been. Read it carefully and answer the questions below.
If the ratio of expenses of A and B is 3:4 in year 2004 then what will be the ratio of their income this year ?
View Answer Discuss on Question Error In Question |
| Q.15 |
Two companies, A and B in the graph below by percent gain made in the last 6 years have been. Read it carefully and answer the questions below.
If in the year 2001 and 2002 the expenditure of B 14.5 lakh and 12 lakh respectively, then what was the total income of B in these two years ?
View Answer Discuss on Question Error In Question |
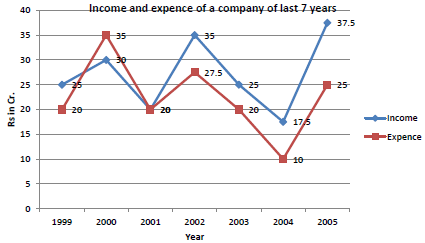
| Q.16 |
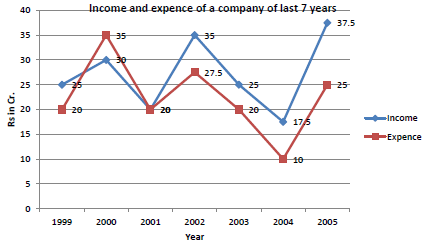
In the graph below there is a description of the income of a company of last 7 years . Read it carefully and answer the questions below.
In which year was the maximum difference in the income and expenditure?
View Answer Discuss on Question Error In Question |
| Q.17 |
In the graph below there is a description of the income of a company of last 7 years . Read it carefully and answer the questions below.
How much percentage decrease in the expenditure from year 2002 to 2003.?
View Answer Discuss on Question Error In Question |
| Q.18 |
In the graph below there is a description of the income of a company of last 7 years . Read it carefully and answer the questions below.
What was the percentage increase of income in 2001 to 2002?
View Answer Discuss on Question Error In Question |
| Q.19 |
In the graph below there is a description of the income of a company of last 7 years . Read it carefully and answer the questions below.
How many of these 7 years expenses will be exceed from income?
View Answer Discuss on Question Error In Question |
| Q.20 |
In the graph below there is a description of the income of a company of last 7 years . Read it carefully and answer the questions below.
|